
Recent Updates
Vault has been widely adopted by many large enterprise companies for managing and rotating secretes, signing server certificates via the PKI Secretes Engine, and even just encrypting sensitive data, so your developers don’t have to worry about it. Teams leverage Vault sidecars to inject secretes into their Kubernetes deployments, and sign server certificates quickly and easily through the Vault API.
Now that all your important and sensitive data has been tied up into a single service, is it secure? Is anything ever completely secure? No. In this article, I will go over root protected endpoints on Vault, searching for them in the Vault audit logs, and irregular patterns to look out for.
1. API Endpoints That Require a Root Token
HashiCorp Vault has a number of API endpoints that require the user to authenticate with a root token. As the name implies, this root token has root access to the entire cluster and should be treated as one of the most valuable tokens from Vault.
List of Root Protected API Endpoints:
- auth/token/accessors
- auth/token/create-orphan
- auth/token
- pki/root
- pki/root/sign-self-issued
- sys/audit
- sys/audit/:path
- sys/auth/:path
- sys/config/auditing/request-headers
- sys/config/auditing/request-headers:name
- sys/config/cors
- sys/config-ui
- sys/internal/specs/openapi
- sys/leases/lookup/:prefix
- sys/leases/revoke-force/:prefix
- sys/leases/revoke-prefix/:prefix
- sys/plugins/catalog/:type/:name
- sys/raw
- sys/replication/reindex
- sys/replication/performance/primary/secondary-token
- sys/replication/dr/primary/secondary-token
- sys/rotate
- sys/seal
- sys/step-down
These API endpoints were collected on 06/01/2020. For the most up-to-date list, visit Hashi’s web page Root protected API endpoints
Many of these API endpoints perform valuable tasks such as auth/token generating new tokens, sys/seal sealing vault
in case of an intrusion, and sys/rotate for rotating the data encryption key. Their importance highlights exactly why
a root token is necessary to make a call to those API paths.
Why should we monitor these paths?
These API paths are of critical importance to monitor because a major spike in failed attempts to authenticate via the root token is a clear indicator of an attempted brute force attack. An ongoing issue on API rate limiting for Vault can be found here, but as it stands the only HTTP API limit is for a maximum payload size of 32MB
2. Search Patterns
Tools and Query Language
To first start capturing the audit logs from Vault and display them on a dashboard, we must set up three things: an audit device, a data collector, and a log aggregation system. Together, these will take your Vault audit logs and ship them from the Vault server to a database where a tool such as Grafana can add it as a data source.
Audit Device
Setting up an audit device is very well outlined by Hashi themselves and only takes a couple of terminal commands to get setup and running. More information on setting these up can be found here. The three types of audit devices to choose from based on your needs are file, syslog, and socket. In this blog post, we are going to focus on just the file audit device.
Data Collector
Now that our Vault audit device has been setup and is writing the logs to the file path we specified, we need to get that data from our Vault instance to our database. To do this, we need a data collector such as td-agent from Fluentd. Setting up td-agent is pretty straightforward, and an example can be found here for shipping logs to S3. To ship the logs elsewhere, Fluentd has a vast list of plugins to choose from.
Log Aggregation System
For setting up monitoring and alerting for your logs, I would suggest deciding on a path first for where and how you want to manage your logs. One option is to leave them with your cloud provider of choice such as AWS, Azure, GCP, etc.. or to manage them completely with a tool such as Loki. In my example, we leveraged Azure Log Monitor to collect the logs and used their Workbooks as a test environment before taking our queries to Grafana with Azure Monitor setup as a Data Source for a more unified dashboard to peak into our audit logs and metrics.
Query Language
Another benefit to the transition from Azure Log Monitor to Grafana with the Azure Monitor plugin was the query language. The Azure plugin for Grafana leverages the same Kusto query language as Azure Log Monitor allowing us to quickly transition from Workbooks to Grafana.
API Request Path
The request path allows for an easy way to filter out unnecessary request types and monitor critical endpoints that require a root token. It’s important to note that just because a path isn’t root protected doesn’t mean it isn’t important to monitor. Specific monitoring should be put in place for the paths listed above, but enabling monitoring for every request type for Vault is extremely valuable.
By leveraging the Vault audit log, you can use a handful of tools to ship these logs off to services for monitoring and alerting. Once your logs are sent off to your service of choice, you can determine how your search pattern should be prepared. In many cases, you will start by filtering out anything that isn’t part of the Vault audit log.
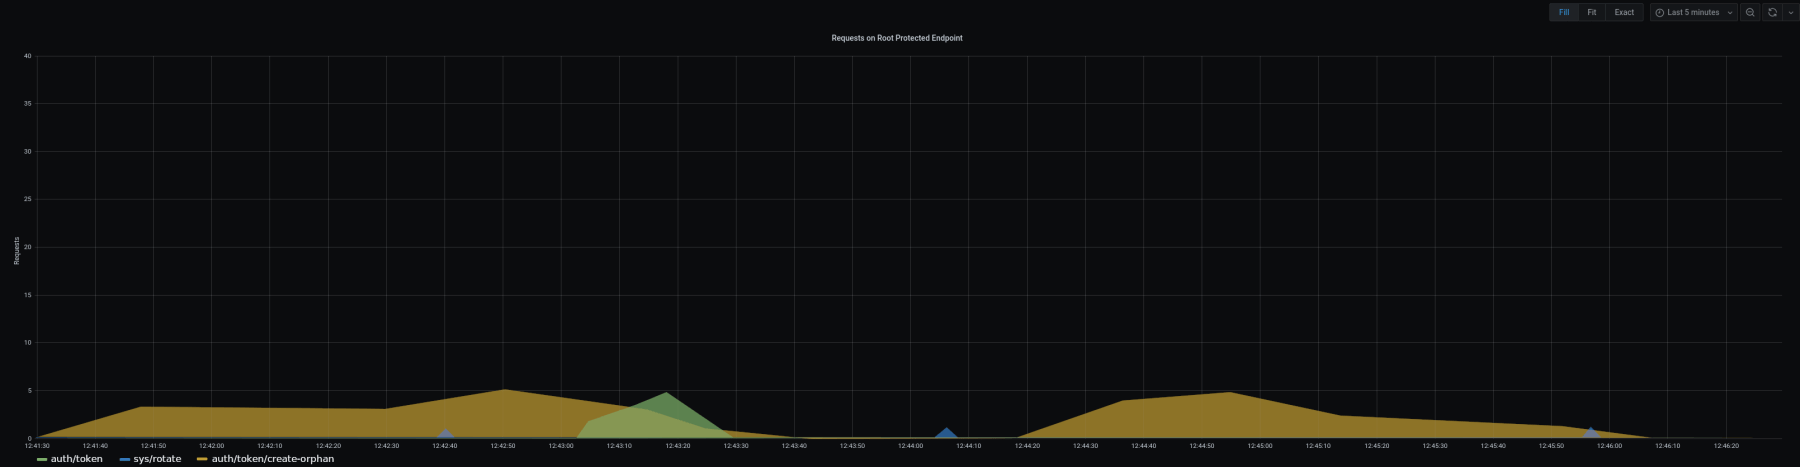
vault_audit_log.request.path == "auth/token"
This will take care of filtering out all other requests from your Vault service and present you with data specific to the request path you specified. From here, you can use this data to render a graph presenting the number of requests for that specific path by time. This allows for a simple visual representation of the status of these API paths. Additionally, rendering a pie chart to visualize all the root protected endpoints at once can provide a glance into the use of the many different paths, and a larger pie slice might be the indicator of an anomaly.
Permission Denied
Now that we have created a query that filters out all other request types other than the root protected endpoints we can move on to capturing failed requests.As explained earlier, an attacker can leverage the API paths to brute force a root token, and in this process, they can send numerous failed requests using random tokens until the right token is reached. While this is improbable based on the time necessary to brute force the standard 27 character token, it can still indicate a bad actor on your network.
The Vault audit log provides an object declaring any errors that occurred during the request. In our case, we are going
to search for the string permission denied as that would indicate that an invalid token was used.
vault_audit_log.request.path == "auth/token"
vault_audit_log.error == "permission denied"
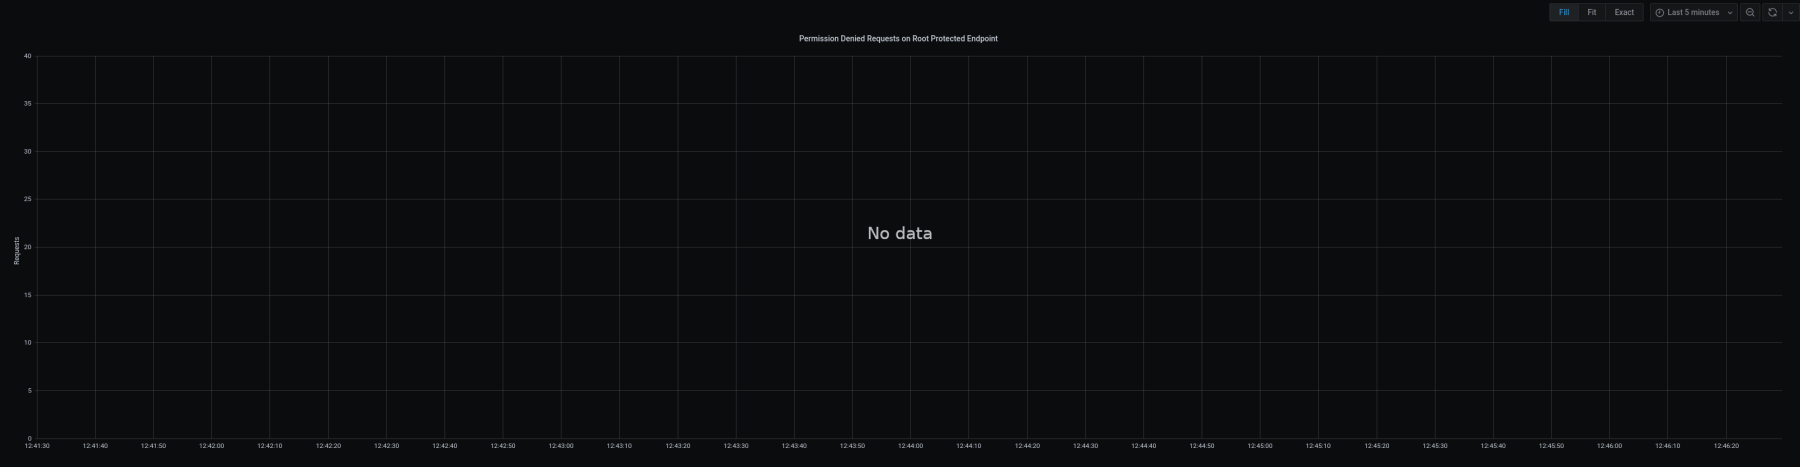
This graph is intentionally left blank as the expected results from this query are null unless a user or service account is using an invalid token
3. Alerting on Irregular Patterns
What Is An Irregular Pattern?
Good question, but there isn’t an easy answer. It will take some time to generate enough data to understand your environment and the number of requests your organization makes to each path. With that being said, an anomaly resulting from a brute force attack will present itself pretty clearly with respect to the rest of the data and stick out like a sore thumb. Get a general sense of your organization’s use of Vault and adjust it as needed moving forward as more services are leveraging Vault.
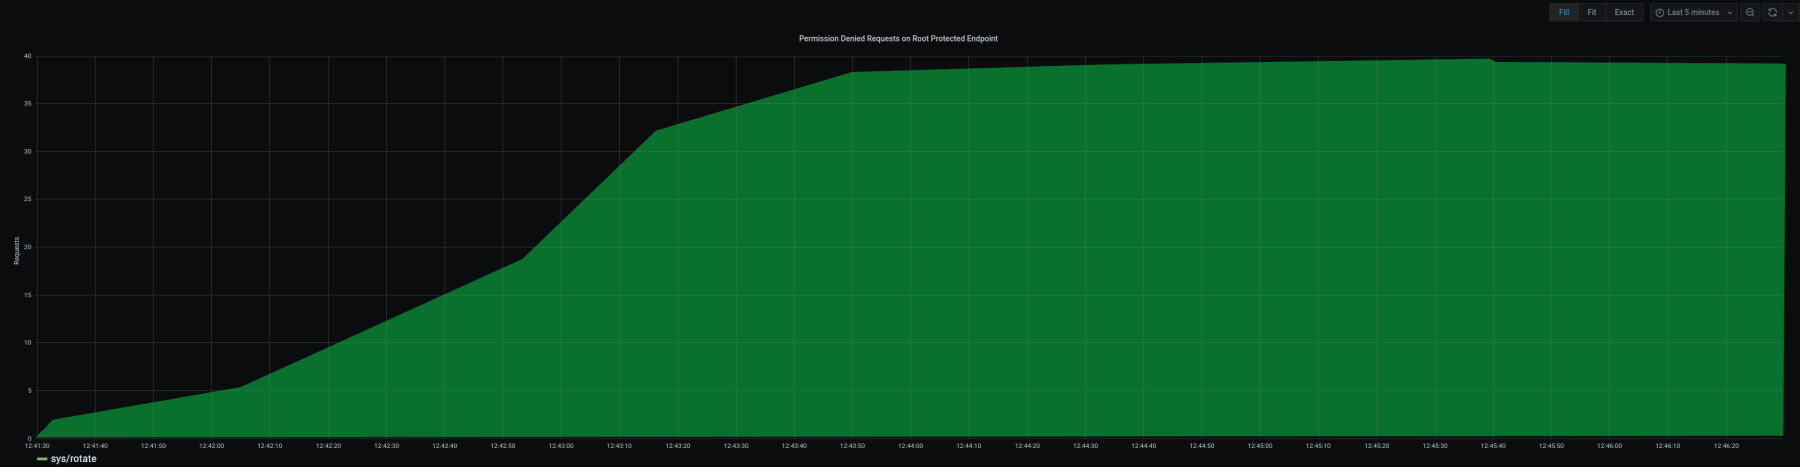
In the example image above, it would be an anomaly to see that many permission denied requests on the sys/rotate API
and may indicate a bad actor on the network or some error in automation.
Setting Alerting
Each tool will have its alerting settings outlined in their docs and ways to alert the appropriate individuals, so any guidance from those specific topics can be gathered from there. When setting your alerting, it is important not to set a threshold so low that you are continually receiving alerts when a team is actively testing their services throughout their day but any number 100x your average load might be too lenient. Anomalies are different for each organization, but setting up monitoring is a great step to learning what those anomalies are.
Conclusion
To summarize, as more organizations adopt Vault as their primary secret store, it is important to emphasize that setting up monitoring and alerting on such a sensitive system is just as important as utilizing a key store in the first place. Vault is a target for any bad actors on a network, and monitoring/alerting might be the first wall between them and your secrets.
Nebulaworks has helped many organizations rapidly adopt Vault in a wide range of computing platforms from architecture design, all the way down to monitoring. You can reach out to us to learn more about how we can help your team get started with Vault services.